
Ke (2021) is not logarithmic
16 Feb 2022[Code]
Last week I published a blog post on whether infectiousness was a linear or logarithmic function of viral RNA count, as measured by PCR. The answer has significant implications for when people can return to school or work after an infection.
At the start of infection, viral RNA count increases exponentially, reaching about a billion copies per mL, before dropping back down to zero. If the linear model is correct, infectiousness is proportional to RNA count, which means you are only meaningfully infectious for a short period near the peak viral load. If the logarithmic model is correct, you’re meaningfully infectious with any amount of virus in your body, even trace amounts.
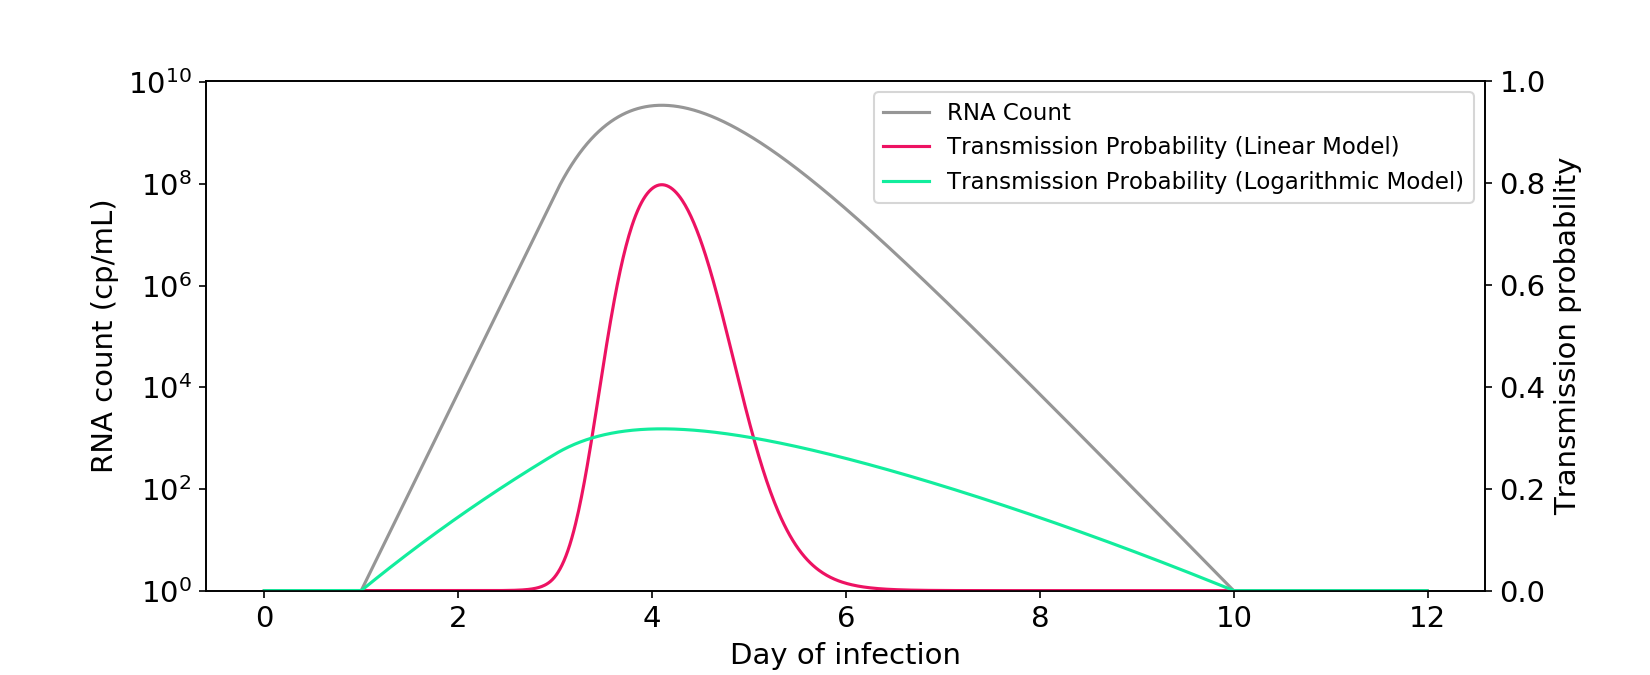
Figure 1. The linear and logarithmic models of infectiousness. The gray curve shows RNA count in a typical infection, plotted on a log axis. The other curves are probabilities of transmission for a one-hour interaction between two people in a medium sized room. Probability is a transformation of the hazard rate (“infectiousness”), which can be modeled as a linear or logarithmic function of RNA count.
My blog post concluded that infectiousness is a mostly linear function of live viral count. But when it comes to observed RNA count, the relationship is intermediate between linear and logarithmic, perhaps a bit closer to linear.
After publishing my blog post, somebody sent me Ke (2021), which claims that the logarithmic model is an appropriate surrogate for infectiousness. The paper is useful and important, but I want to respond to their core claim.
The model isn’t logarithmic!
First and foremost, the actual Ke (2021) model isn’t logarithmic. I’ve reproduced their power-law model below. If anything, it’s much closer to linear than logarithmic!
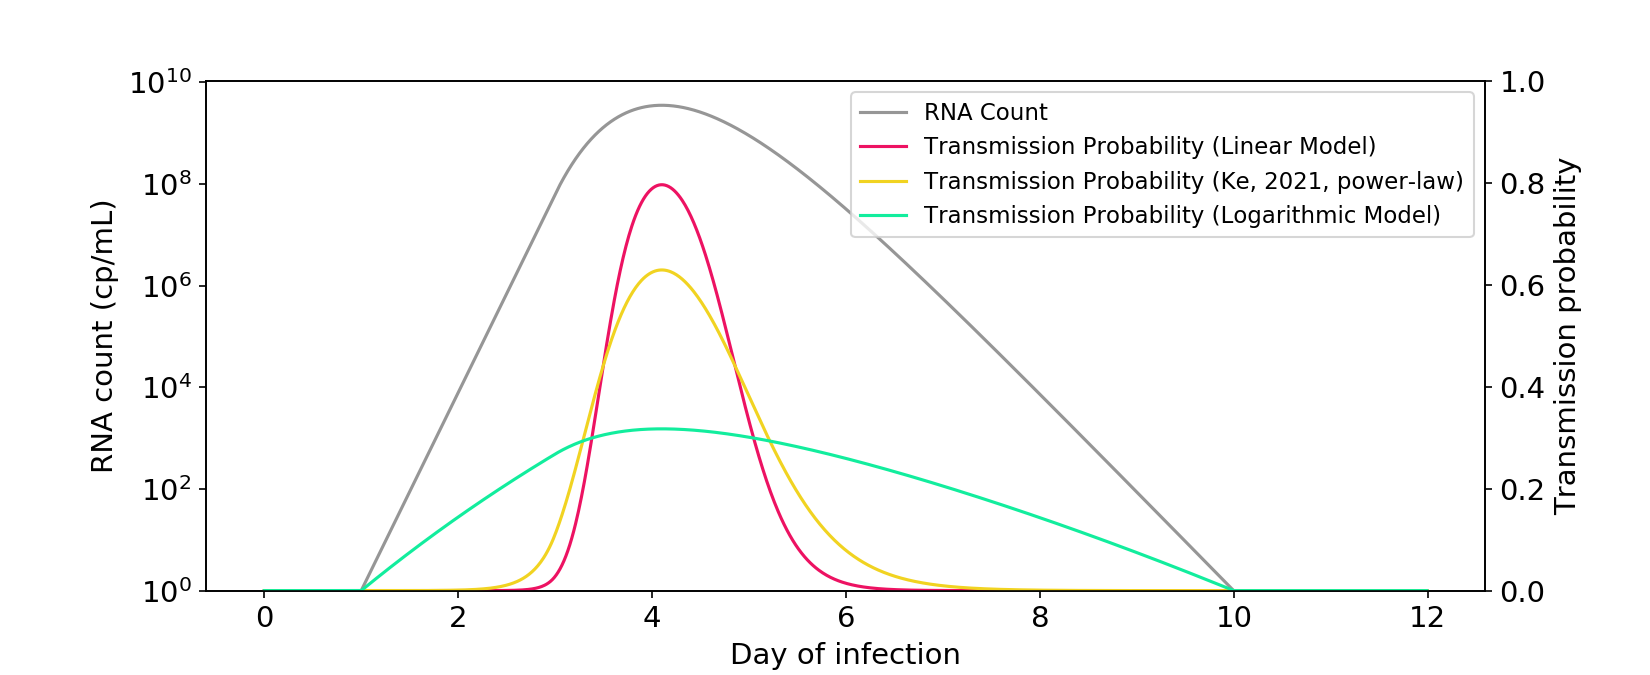
Figure 2. The power-law model described in Ke (2021) is closer to a linear model than a logarithmic model. The \(\phi\) parameter is rescaled so that there is a similar area under the curve as the other models.
The paper also presents a saturation model. While it’s less linear than the power-law model, I think it’s fair to call it midway between linear and logarithmic.
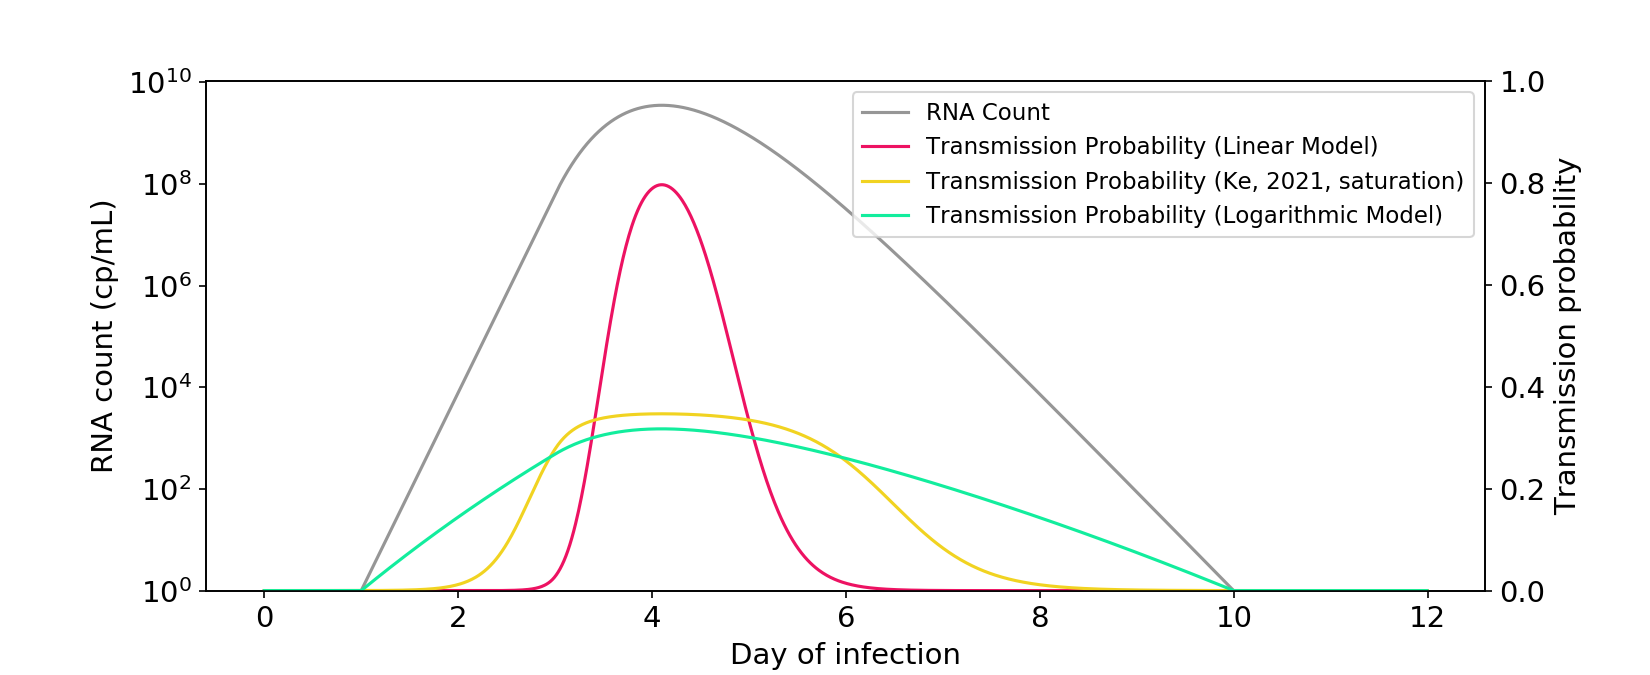
Figure 3. The saturation model described in Ke (2021) falls between a linear model and a logarithmic model. The \(\theta\) parameter is rescaled so that there is a similar area under the curve as the other models.
I’m not sure why Ke (2021) comes to a “logarithmic” conclusion, given that both of their models are not too far from linear. I suspect it was mostly an oversight. Covid research moves fast, and perhaps they were visualizing their data in a different way than I am.
The symptom data isn’t that convincing
Ke (2021) uses some symptom data to provide additional evidence for nonlinearity. The argument is as follows: Epidemiological evidence suggests that >30% of transmission occurs pre-symptomatically. Data from Wölfel (2020) suggests that symptom onset occurs early in the viral load curve. Under the linear model, almost all transmission would occur around the peak of infection and – using the Wölfel data – only 8% would occur pre-symptomatically. Because this is lower than the >30% observed epidemiologically, the linear model should be rejected.
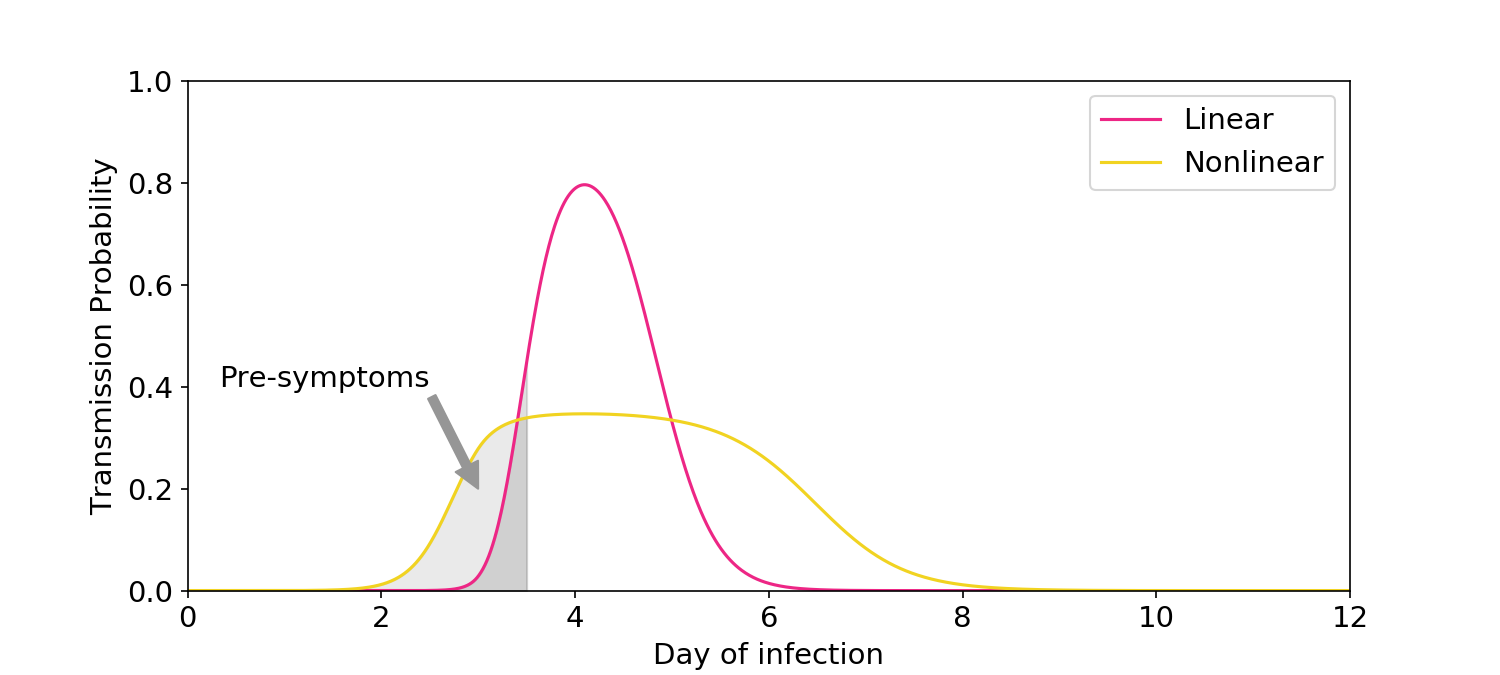
Figure 4. Illustration of the symptom logic used in Ke (2021). The linear model predicts only a small amount of transmission would occur before symptoms, which is inconsistent with epidemiological data.
I don’t want to strictly defend the linear model – I concede there is some nonlinearity. But much of Ke’s evidence from symptom data feels overstated.
First, Ke’s 8% estimate is based on an assumption of uniformly distributed contacts over time. In reality, people reduce their rate of contacts once symptoms start. The linear model should therefore predict significantly more than 8% of transmission occurs pre-symptomatically, which is more consistent with the epidemiological data. To their credit, the authors acknowledge the limitation of their assumption.
Second, the authors describe Wölfel (2020) as showing symptom onset occurs very early along the viral load curve. But this is inconsistent with many other studies, which shows that symptom onset occurs at or even after the peak of viral load. If those studies are true, the linear model would predict that upwards of 50% of infection occurs pre-symptomatically, consistent with the epidemiological data. In general, I suspect that the definition of “symptom onset” is murky, and that any conclusions based on cross-study comparisons will be fraught with uncertainty.
To summarize, the nonlinear models in Ke (2019) are important and useful; they just aren’t logarithmic! The truth is intermediate between linear and logarithmic and, if anything, may be slightly closer to linear.
[Code]