
10x the live viral count, 10x the infectiousness
10 Feb 2022[Code]
Here’s a plot of SARS-CoV-2 “viral load” over the course of an infection, where “viral load” is measured by PCR. At the start of infection the number of viral RNA copies is close to zero, but it quickly and exponentially shoots up to about a billion cp/mL before dropping back down again.
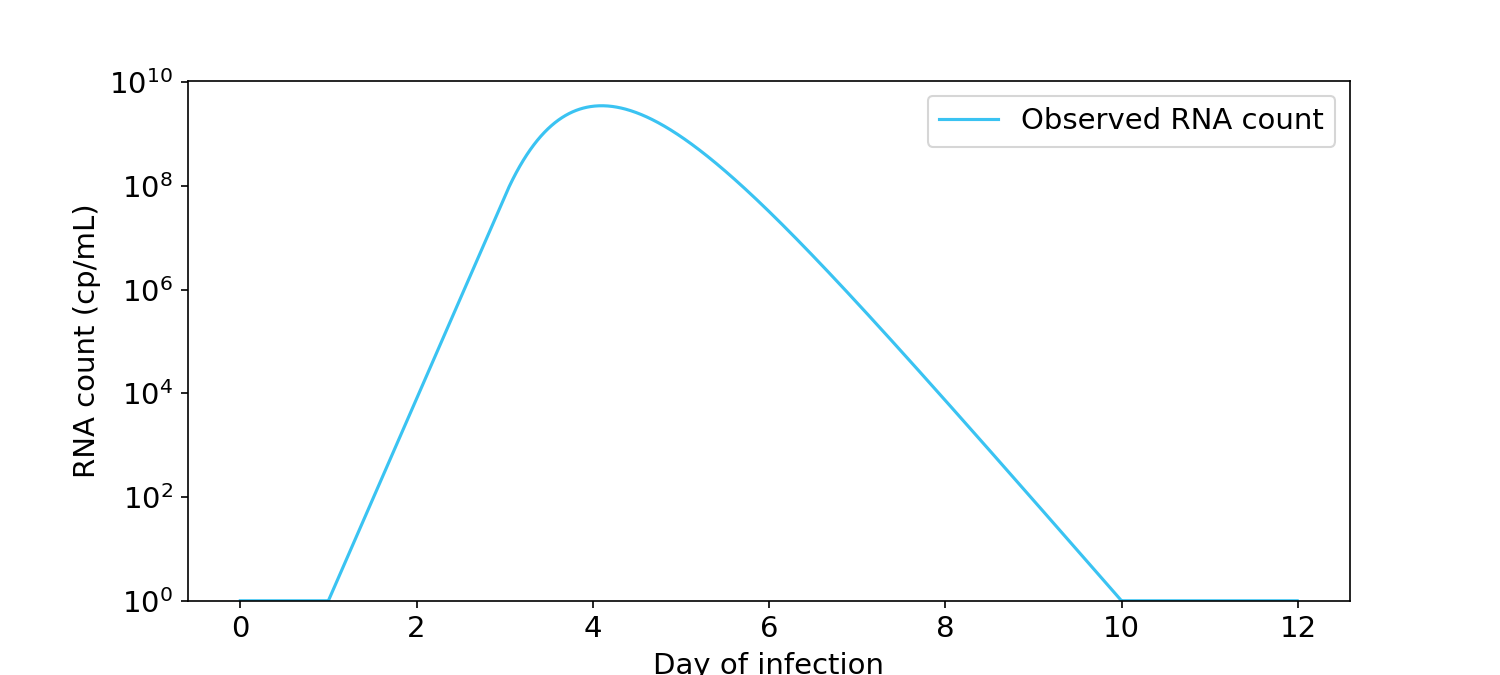
Figure 1. Viral load over time for a typical infection, as measured by PCR in RNA copies/mL (Kissler, 2021). Y-axis is in log units.
A question that everyone asks is: When are you infectious? It would be extremely useful if RNA count could be converted into a probability of infecting others. If we knew that relationship, we would better understand when it’s safe for infected people to return to school or work.
Many people have an intuition that infectiousness is proportional to the logarithm of the RNA count (Figure 2). Under this view, someone at 10\(^8\) cp/mL is twice as infectious as someone at 10\(^4\) cp/mL. If this view is true, people should arguably not return to school or work until all of the viral RNA has left their body.
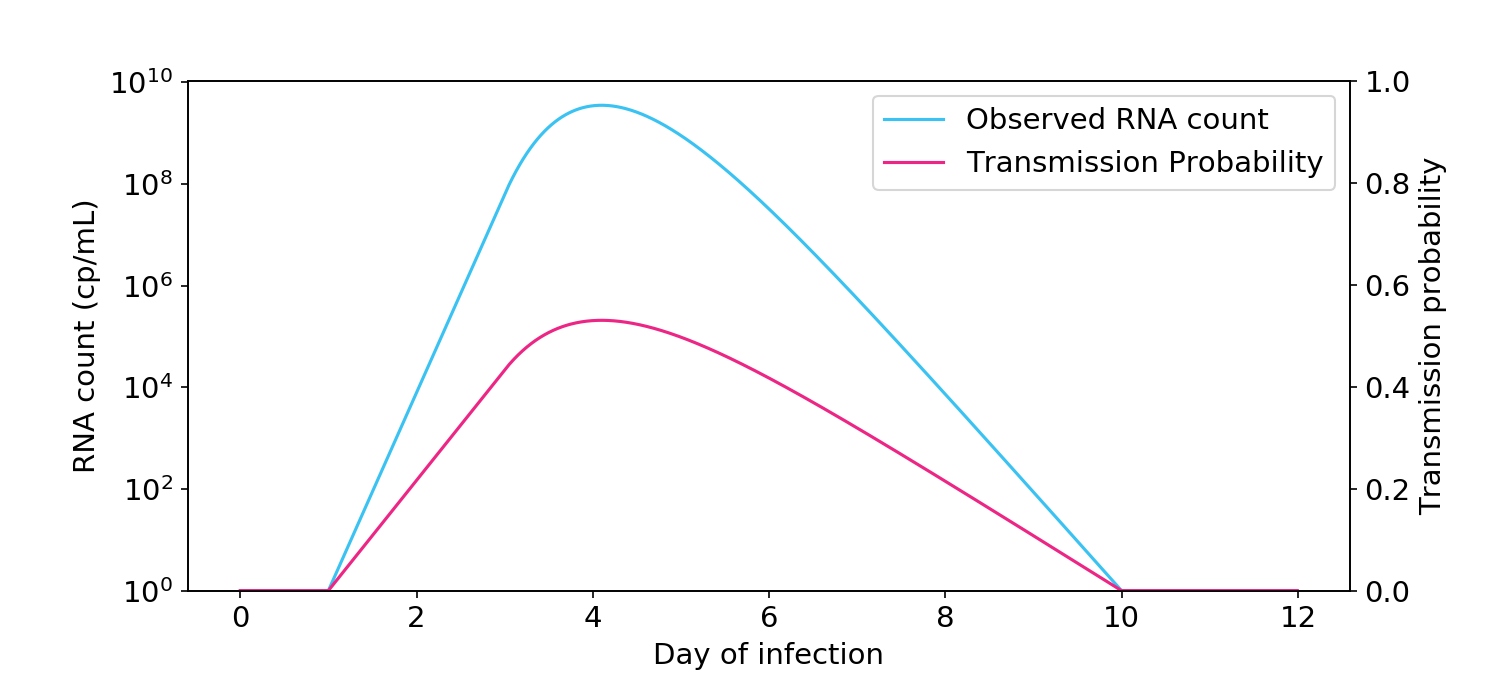
Figure 2. The logarithmic view of infectiousness, where infectiousness is proportional to the logarithm of viral count, as measured by PCR. Transmission probability (blue, right hand side y-axis) is the probability of transmission between two people in a short one-hour interaction.
Other people have the intuition that infectiousness is directly proportional or “linearly” related to RNA count (Figure 3). Under this view, someone at 10\(^8\) cp/mL is 10,000 times more infectious than someone at 10\(^4\) cp/mL. If this view is true, people should return to school when their RNA count dips below 10\(^5\) cp/mL or even 10\(^6\) cp/mL, which is typically around the point that antigen tests stop being positive.
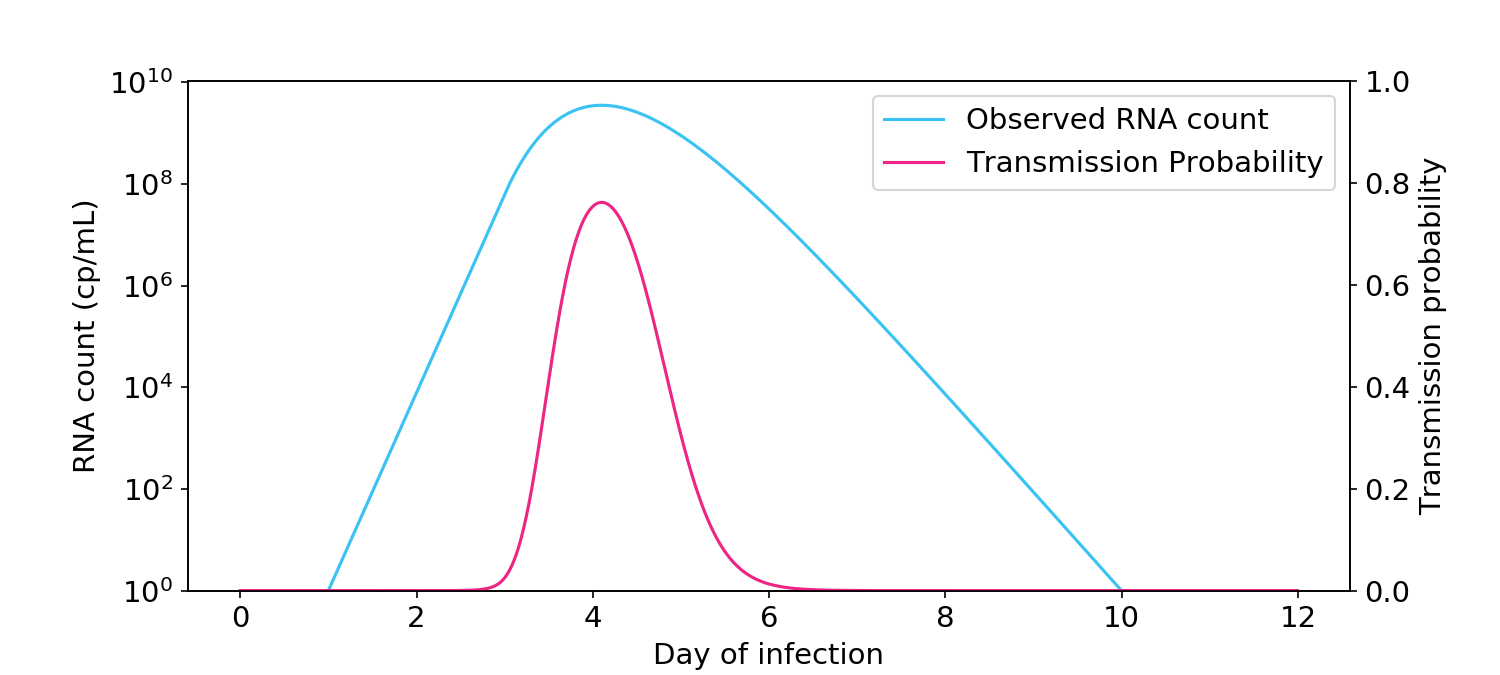
Figure 3. The linear view of infectiousness, where infectiousness is directly proportional to viral count.
So who’s right? To find out, let’s turn to some quantitative models of transmission via aerosols. Not to spoil the fun, but we’ll learn that:
- The relationship between live virus and infectiousness is mostly linear.
- The relationship between observed RNA count and infectiousness is intermediate between linear and logarithmic, due to uncertainty between observed RNA count and live virus count.
Transmission hazard rate is proportional to live virus count
The aerosol box model of transmission (Buonanno, 2020; Peng, 2022) is, as far as I can tell, the standard model of transmission in the literature. Essentially a survival analysis model, it describes how virus in the respiratory tract is exhaled into the air before getting partially ventilated, filtered, and decayed. Once in the air, the virus is inhaled into another person’s respiratory tract and probabilistically causes an infection. Take a couple minutes to look at this figure and pay attention to the colors, as I use them consistently in my graphs.
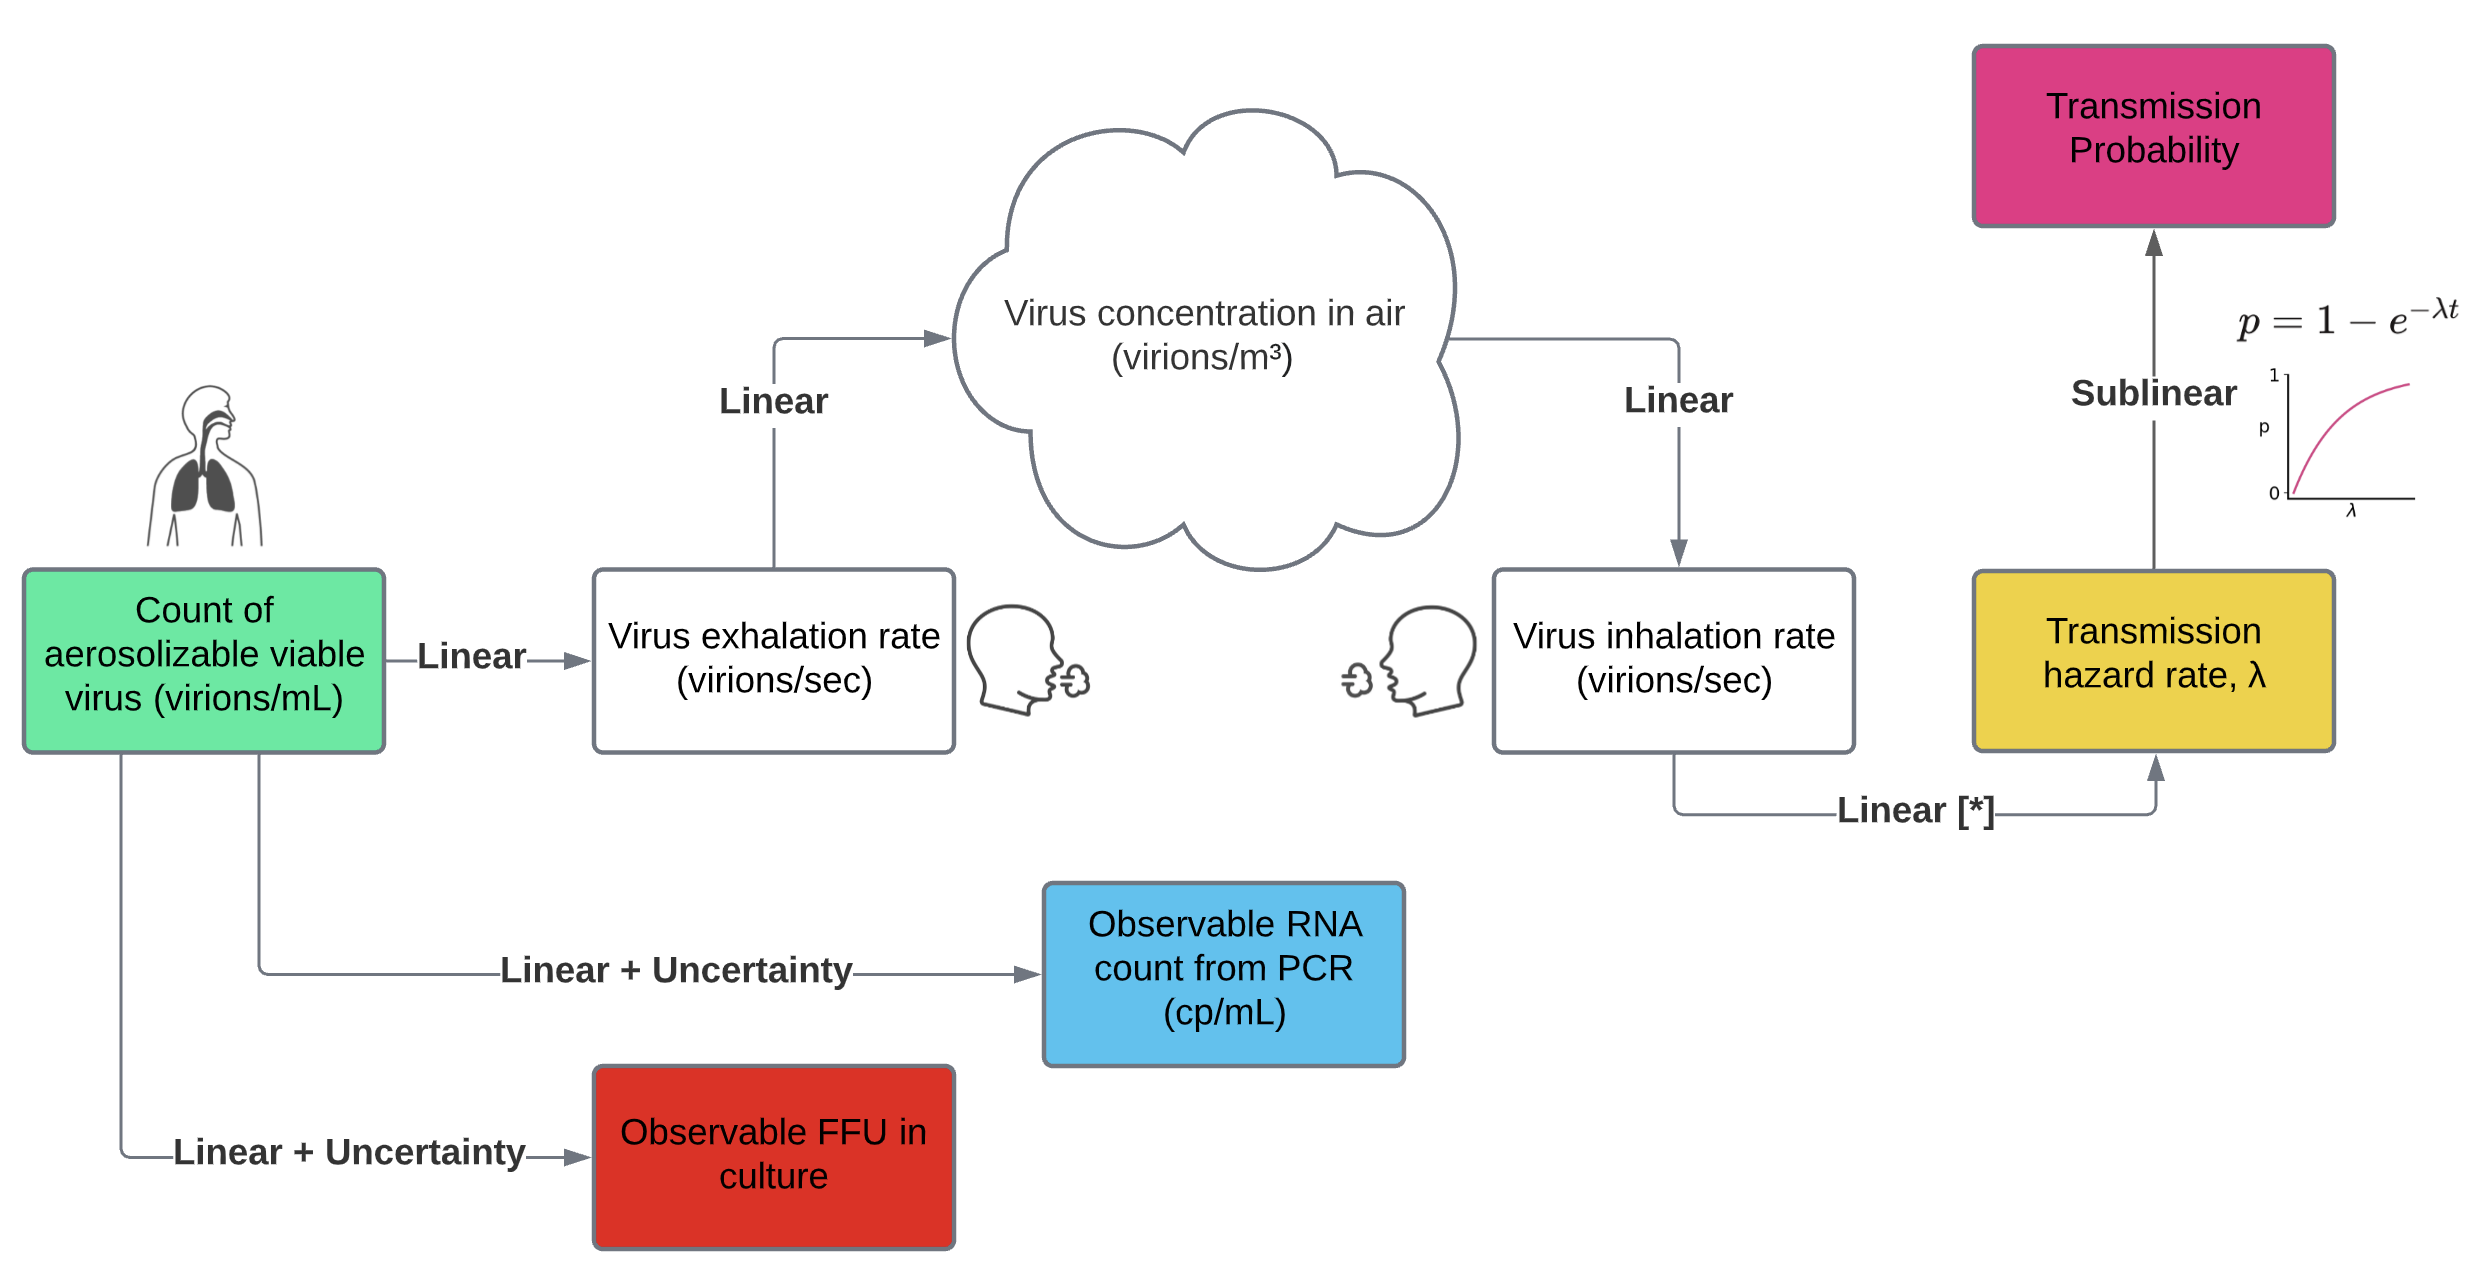
Figure 4. The aerosol box model of transmission, with some extensions for measurement uncertainty.
Each step in the model is a linear function of the count of aerolizable virus inside the infected person. More precisely, the output of each step is proportional to the input viral count. If you reflect on each step, linearity is the most plausible option.
- The rate of exhaled viruses is proportional to the count of virus in aerosolizing parts of the respiratory tract. For evidence, see Figure 3B of Stakenborg (2021).
- The virus concentration in the air is proportional to the count of exhaled viruses. Other dynamics are at play, including ventilation, filtration, deposition, and decay. But all of those dynamics are just scale factors on concentration of virus in the air. I asked several experts whether any of these dynamics could significantly depend on virus concentration, and they all thought it was unlikely.
- The number of inhaled viruses is proportional to the concentration in the air. How could it not be?
- The hazard rate of infection (\(\lambda\)) is proportional to the number of inhaled viruses. Some researchers believe the dose response function might involve supralinear threshold effects. But such an assumption is not very biologically plausible. Even if the relationship were supralinear, it would argue against the logarithmic view of infectiousness, which is sublinear.
- Transmission probability is by definition a sublinear function of the hazard rate. At low levels of virus, a doubling of the virus count doubles your risk of infection. But at very high levels of virus, you’re going to get infected no matter what.
If we accept the linearity of each step above, then infectiousness, which is captured by the hazard rate, is proportional to the amount of aerosolizable virus in the infected person.
To demonstrate the linear effect, I reproduced the box model of Buonanno (2020) and Peng (2022) and extended it by inputting the viral load curves measured by Kissler (2021). I assumed that two people talk with each other for one hour in a 100 m\(^3\) room with ventilation levels similar to an office. One person is infectious and the other is not. As you can see in the plot below, the relationship between virus count and infectiousness is linear.
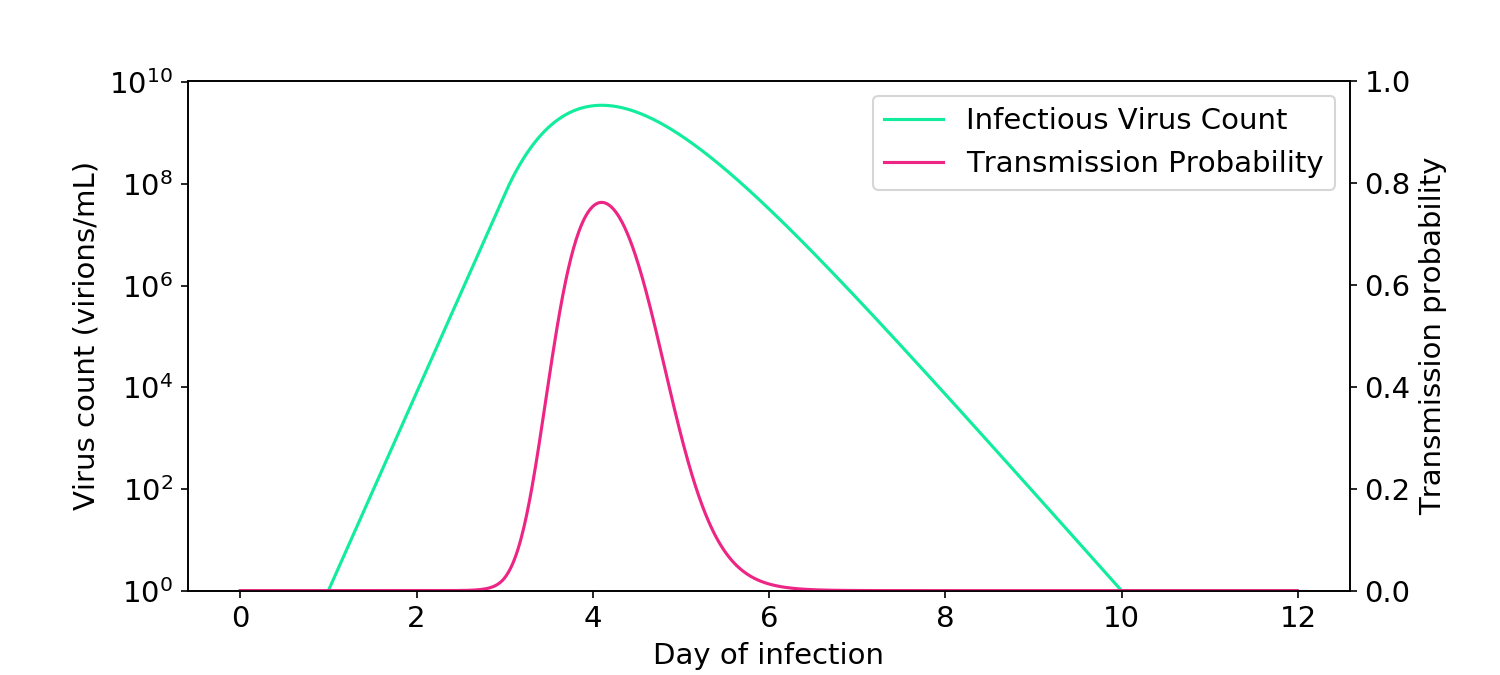
Figure 5. Simulations based on the aerosol box model of transmission (Buonanno, 2020; Peng, 2022) demonstrate how infectiousness is proportional to virus count.
Live virus count is mostly proportional to RNA count
Attentive readers may have noticed that Figure 6 shows that hazard rate is proportional to virus count (in green), whereas what we really care about is whether hazard rate is proportional to RNA counts (shown elsewhere in blue), since that’s what’s most easily measured. For this to be true, the RNA count must be proportional to the virus count, an assumption that is sometimes controversial. Last week, however, extraordinary data from a challenge trial emerged that clearly shows the two variables are proportional (Killingley, 2022).
The plots from that paper show RNA count (blue) and a cultured virus count measurement known as FFU (red), which is proportional to the live virus count (Figure 6). The relationship is proportional, appearing as a vertical offset since both curves are on a log axis. Since RNA count is proportional to cultured FFU, it must also be proportional to live virus. And since it is proportional to live virus, it must also be proportional to the transmission hazard rate, if we accept the aerosol box model of transmission.
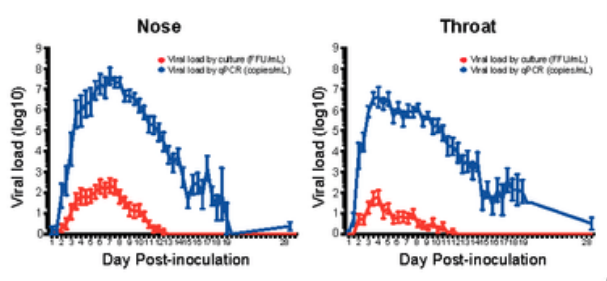
Figure 6. I am only showing this horribly rasterized image because the data is so good. Cultured virus count is proportional to RNA count. Data is averaged over 36 volunteers. Individual curves can be viewed here.
But uncertainty in the relationship weakens the linearity to infectiousness
While the relationship between RNA count and infectious aerosolizable virus is mostly proportional, there are a couple ways the relationship could break down. First, PCR measurement of RNA can be unreliable. In particular, inter-test reliability has a standard deviation of about 0.75 logs (Figure 1A of Arnaout, 2020, assuming 3 Cts per log). Second, there may be differences in virus count between the parts of the respiratory tract that are swabbed and those that produce aerosols. In particular, as the plot above shows, there may be differences in timing between the nose and the throat.
To capture this uncertainty, I ran some Monte Carlo simulations. Following Sender (2021), I used a starting assumption of a 1:1 RNA:virus ratio, although the exact value of the ratio is arbitrary and not essential (see notebook). I then randomly perturbed the virus count curve with a vertical standard deviation of 0.75 logs and horizontal standard deviation of 0.75 days.
On each iteration, I computed the probability of transmission at each point of the time series, and then averaged all the curves.
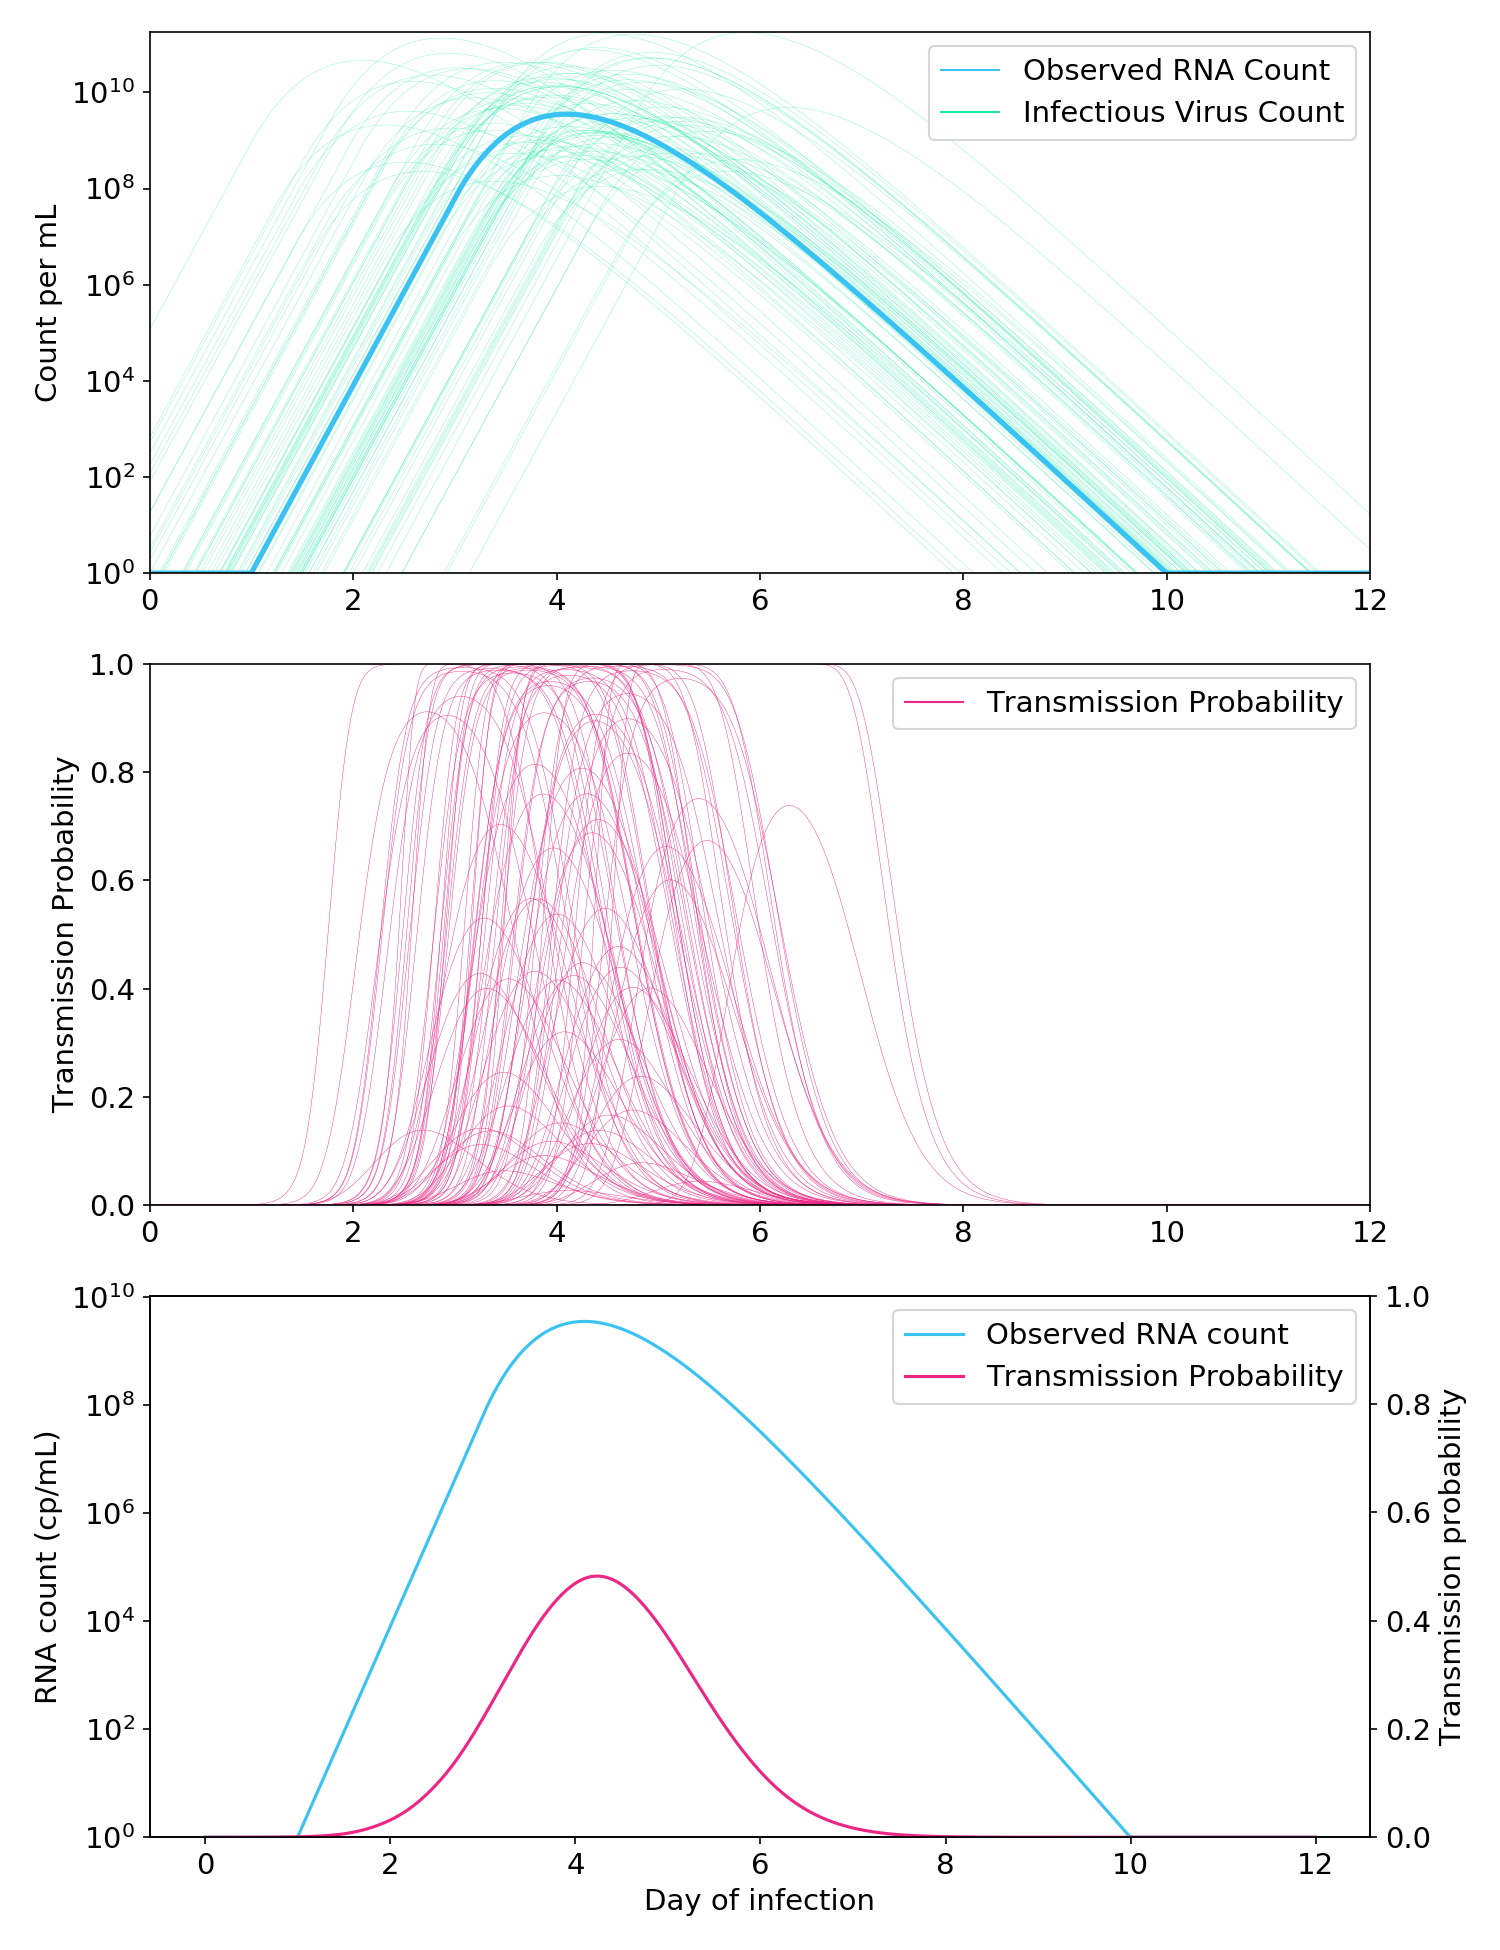
Figure 7. Monte Carlo simulations to account for the uncertain relationship between the RNA count and the infectious aerosolizable viral count. Top: Thousands of possible infectious virus count curves are generated from a single “observed” RNA count curve. Middle: A Cthulhu-like illustration of how each virus count curve is passed through the aerosol box model (here, two people talking in a room for one hour) to generate a probability of transmission. Bottom: Observed RNA count and probability of transmission, where the probability of transmission is averaged over all simulated probability curves in the middle plot.
As expected, the addition of uncertainty made the relationship between observed RNA count and infectiousness less linear (Figure 7, bottom). Nevertheless, it was still far more linear than a full logarithmic relationship, and the probability of transmission when the RNA count was greater than 10\(^5\) cp/mL remained very low.
To summarize:
- The relationship between aerosolizable viral count and transmission hazard rate is mostly linear.
- Because of uncertainty in the relationship between observed RNA count and viral count, the relationship between observed RNA count and transmission hazard is somewhat less linear, but still reasonably linear.
- You can go back to work or school once your RNA count is below 10\(^5\) cp/mL.
- This is the same level of virus at which rapid antigen tests stop being positive.
Update
After I published this post, somebody sent me Ke (2021), which claims that the logarithmic model is an appropriate surrogate for infectiousness. It’s an important paper with useful models, but as I detail in a followup post, their models aren’t logarithmic! Like my noise model, the models are intermediate between logarithmic and linear and, if anything, are closer to linear.
[Code]