
Waning immunity and the little paradox of R0
01 Jan 2022Disclaimer: I’m not an epidemiologist, so adjust your priors accordingly. Code available here.
A classic finding from epidemiology is that in a single-wave epidemic, reducing R0 lowers the number of cases. To reduce R0, most countries have adopted some combination of Non-Pharmaceutical Interventions (NPIs) like masks and testing.
But in a multi-wave epidemic with waning immunity, a contrarian intuition about R0 might cross one’s mind. By keeping cases low, might we be making our population more vulnerable to the next wave? The dynamic could be similar to forest fires. We might be able to stop forest fires now, but we’ll just build up dry tinder for a worse forest fire later. Since waves of Covid are inevitable, why bother fighting it?
These ideas are important but hand-wavy, so I decided to build a model. What I found was at once surprising and clarifying.
Model background
I used a standard SIR model with seasonality and waning immunity. Slow seasonally-based changes in R0 drive sharp seasonal waves of infection. Because of waning immunity, the sharp waves of infection continue indefinitely.
My analysis focuses on years 2-6 of the epidemic and my code can be found here.
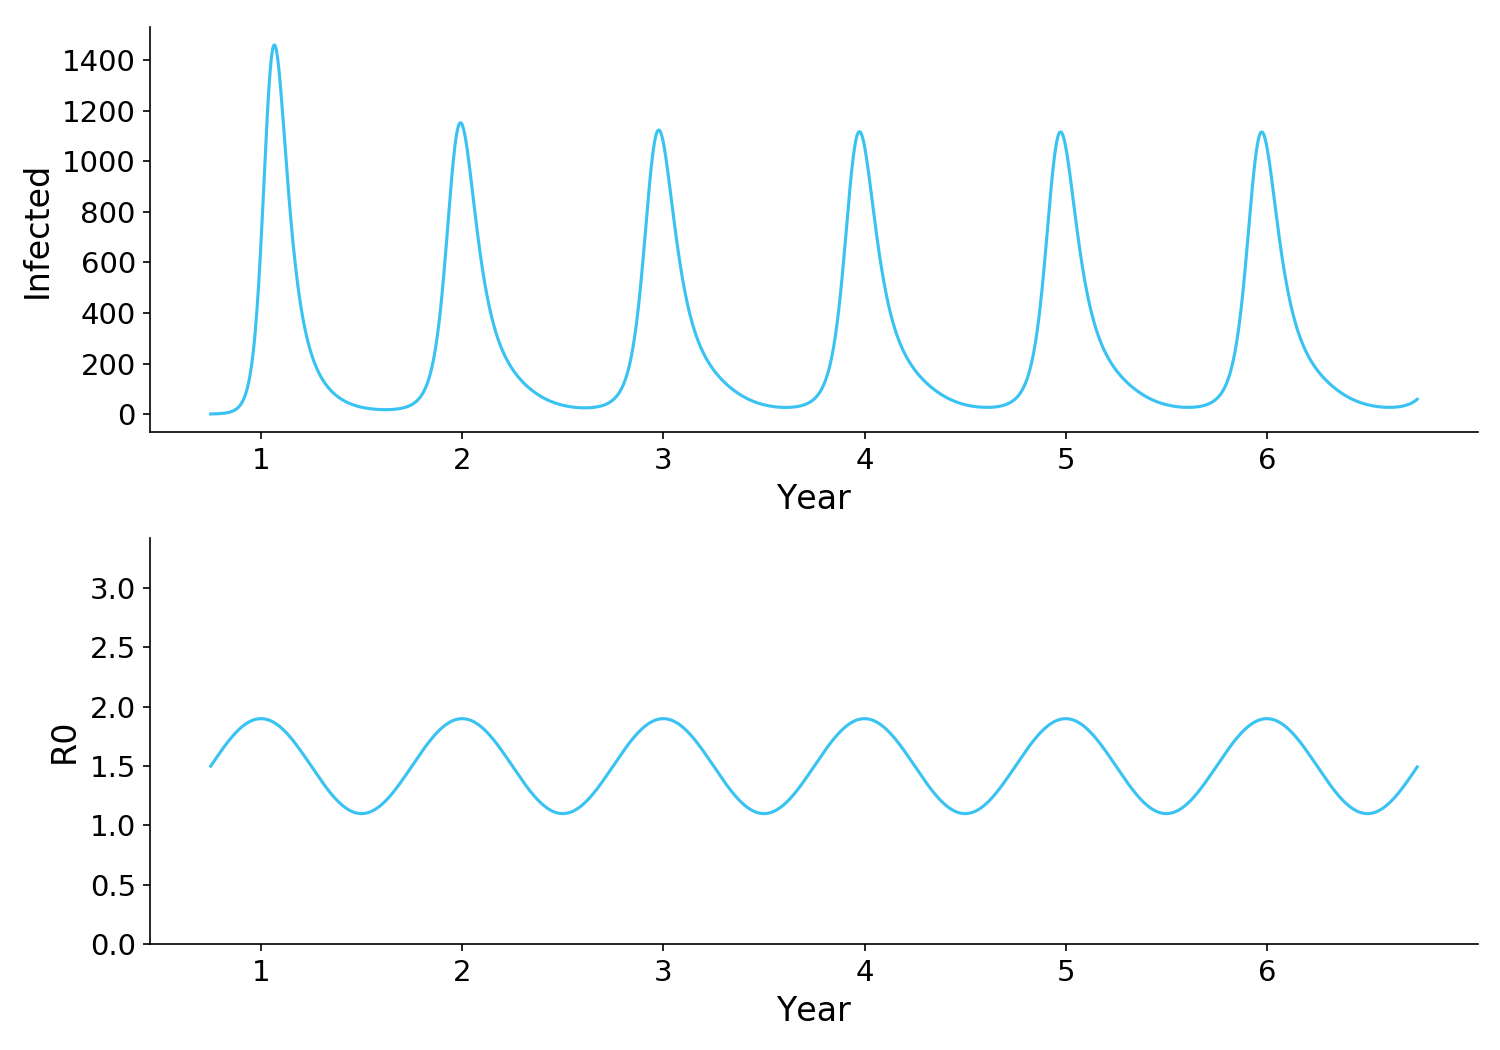
Figure 1. A standard SIR model with seasonality and waning immunity. R0 is determined by seasonality, increasing as people spend more time indoors in the winter. Waning immunity (not shown) replenishes the susceptible population, allowing the waves of infection to continue indefinitely.
Observation 1: Reducing R0 reduces total infections, even with waning immunity
The first observation is that reducing R0 always drives a long-term reduction in cases, even if it doesn’t eliminate waves.
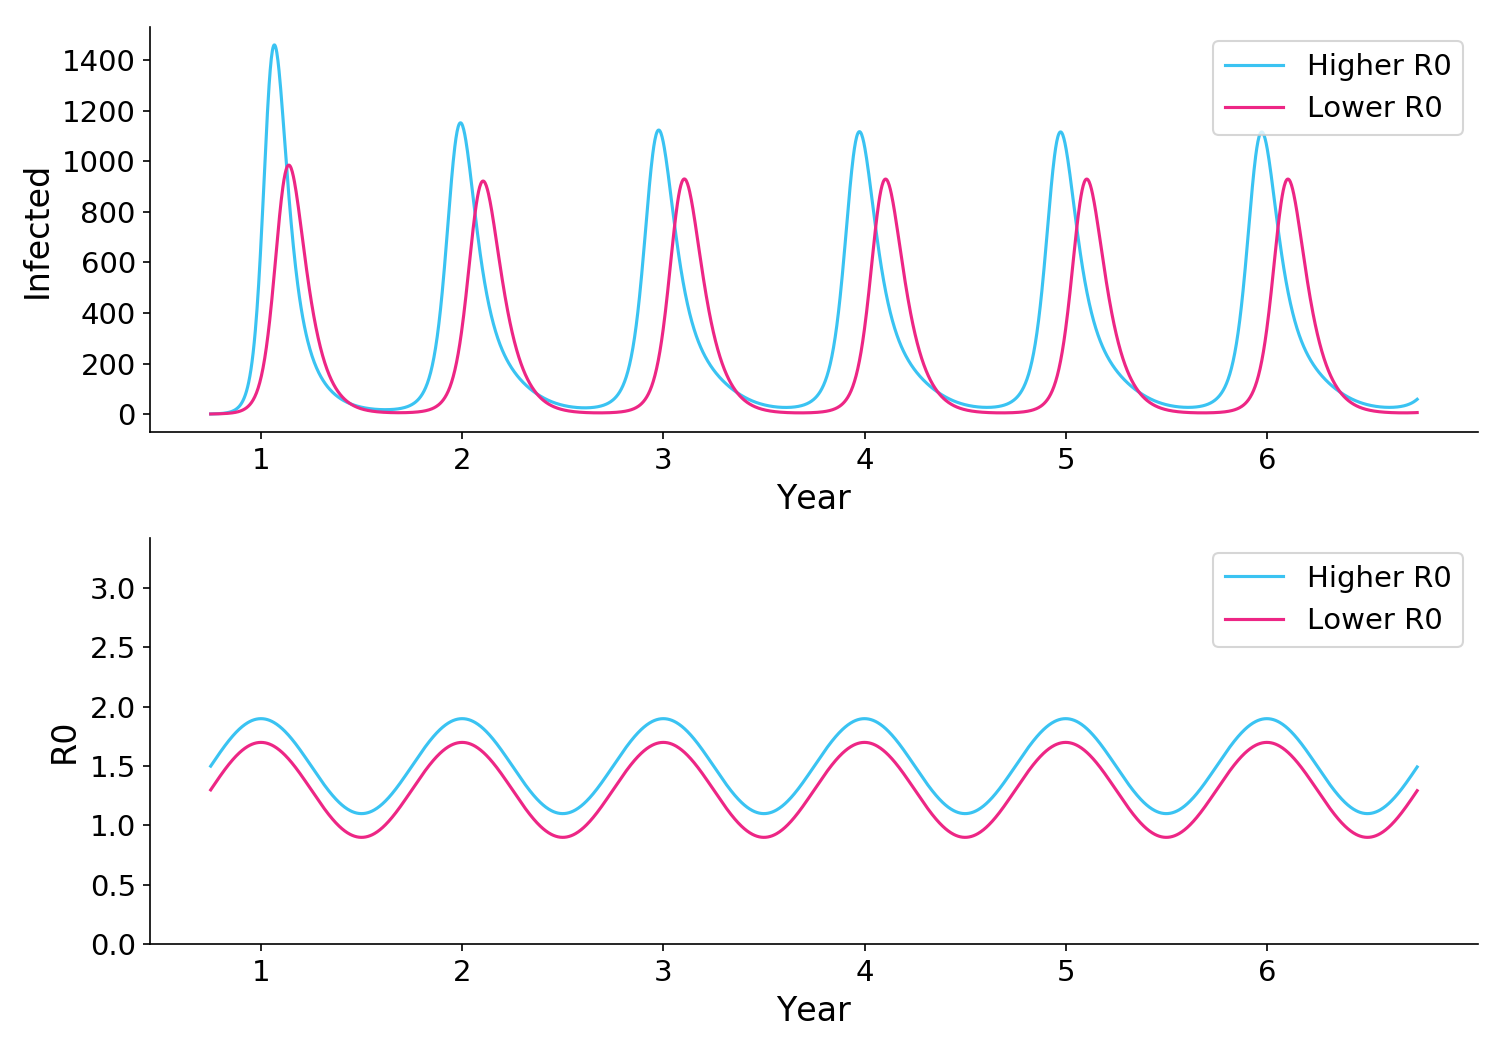
Figure 2. Reducing R0 via NPIs or other methods will always lead to fewer infections.
Why is this relevant? A lot of people have pointed out the UK has widespread access to rapid tests, and yet still got hit by a strong Omicron wave. Some have claimed that this demonstrates the futility of rapid tests.
But as these simulations show, it’s entirely possible that UK rapid tests may have significantly reduced infection, relative to what it would be otherwise. Rapid tests won’t end the pandemic, but they can still drive a useful reduction in infection.
Observation 2: Reducing R0 can sometimes cause higher peaks
The second and more interesting observation is that in many parts of the parameter space – particularly where baseline R0 is high – a reduction in R0 can paradoxically cause higher peaks. That’s because by preventing infections during the summer months, we might create a more vulnerable population during the winter months.
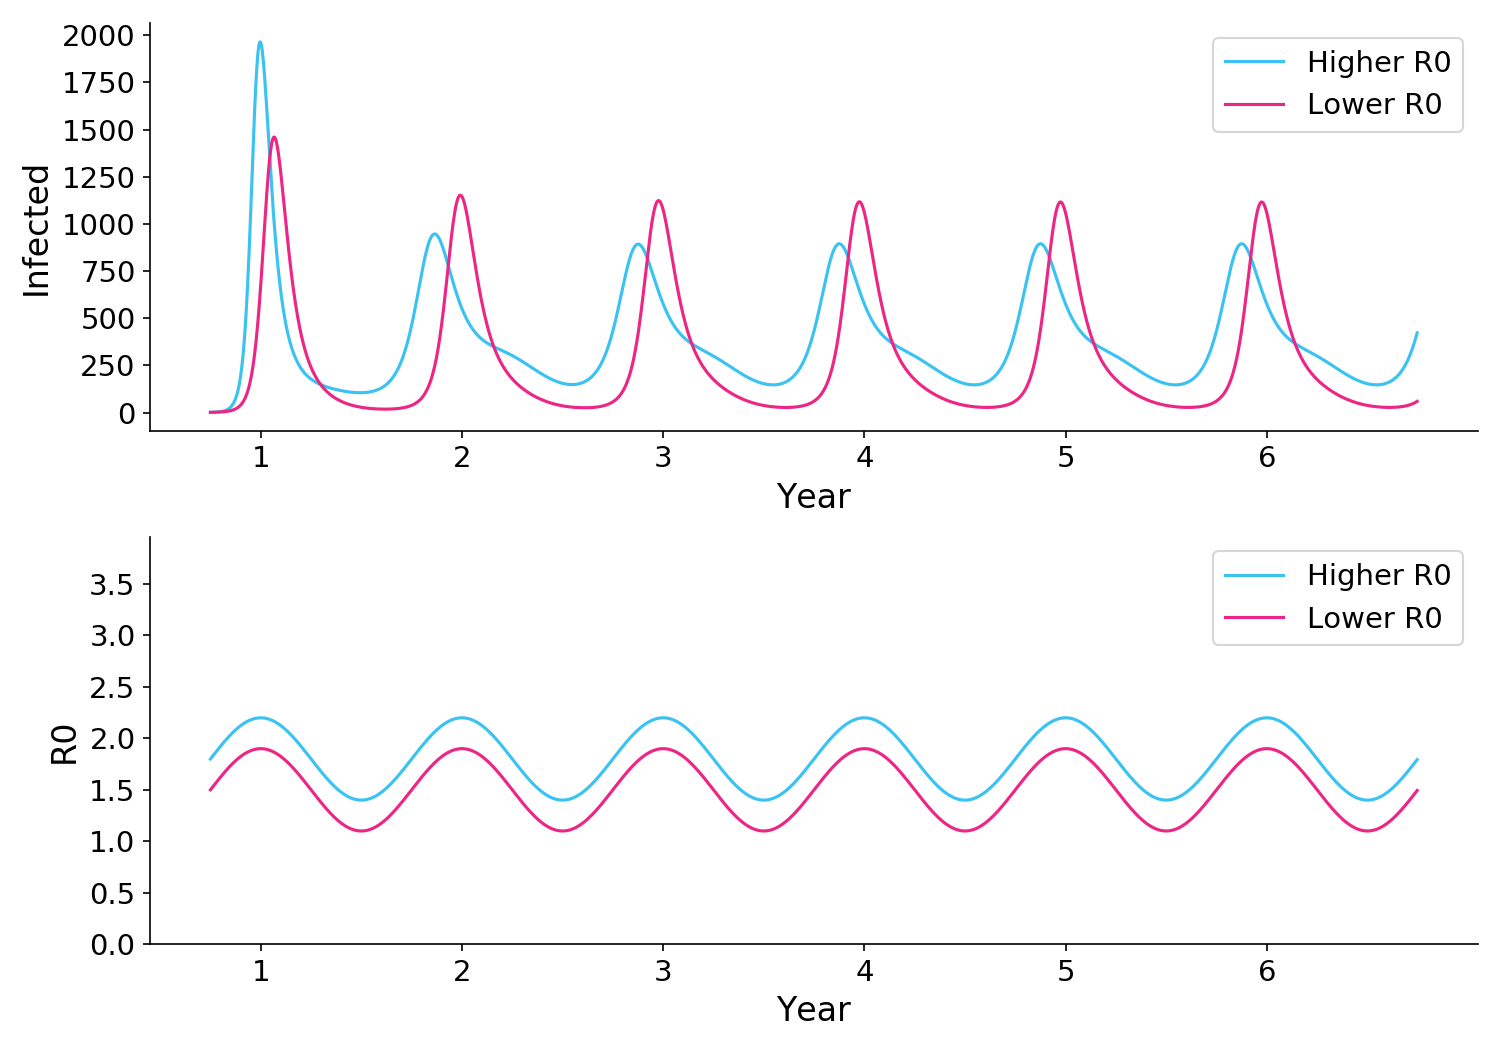
Figure 3. In some sitautions, reducing R0 can paradoxically lead to stonger peaks after the first year, even though the total number of infections is reduced.
I must stress though, that in all scenarios where lower R0 caused stronger waves, the overall number of infections (i.e. including both peaks and troughs) was lower.
This means there is a kernel of truth to the contrarian hypothesis about R0. Fighting forest fires always reduces the overall amount of fire; but because of the dry tinder you build up, you risk some really bad fires.
Observation 3: R0-induced waves can be mitigated by adapting behavior
When considering load on our medical system, it is worrisome that reducing R0 might paradoxically increase the strength of waves. Thankfully, this effect can be mitigated by preferentially reducing R0 when infections go up, for example via stronger testing or social distancing.
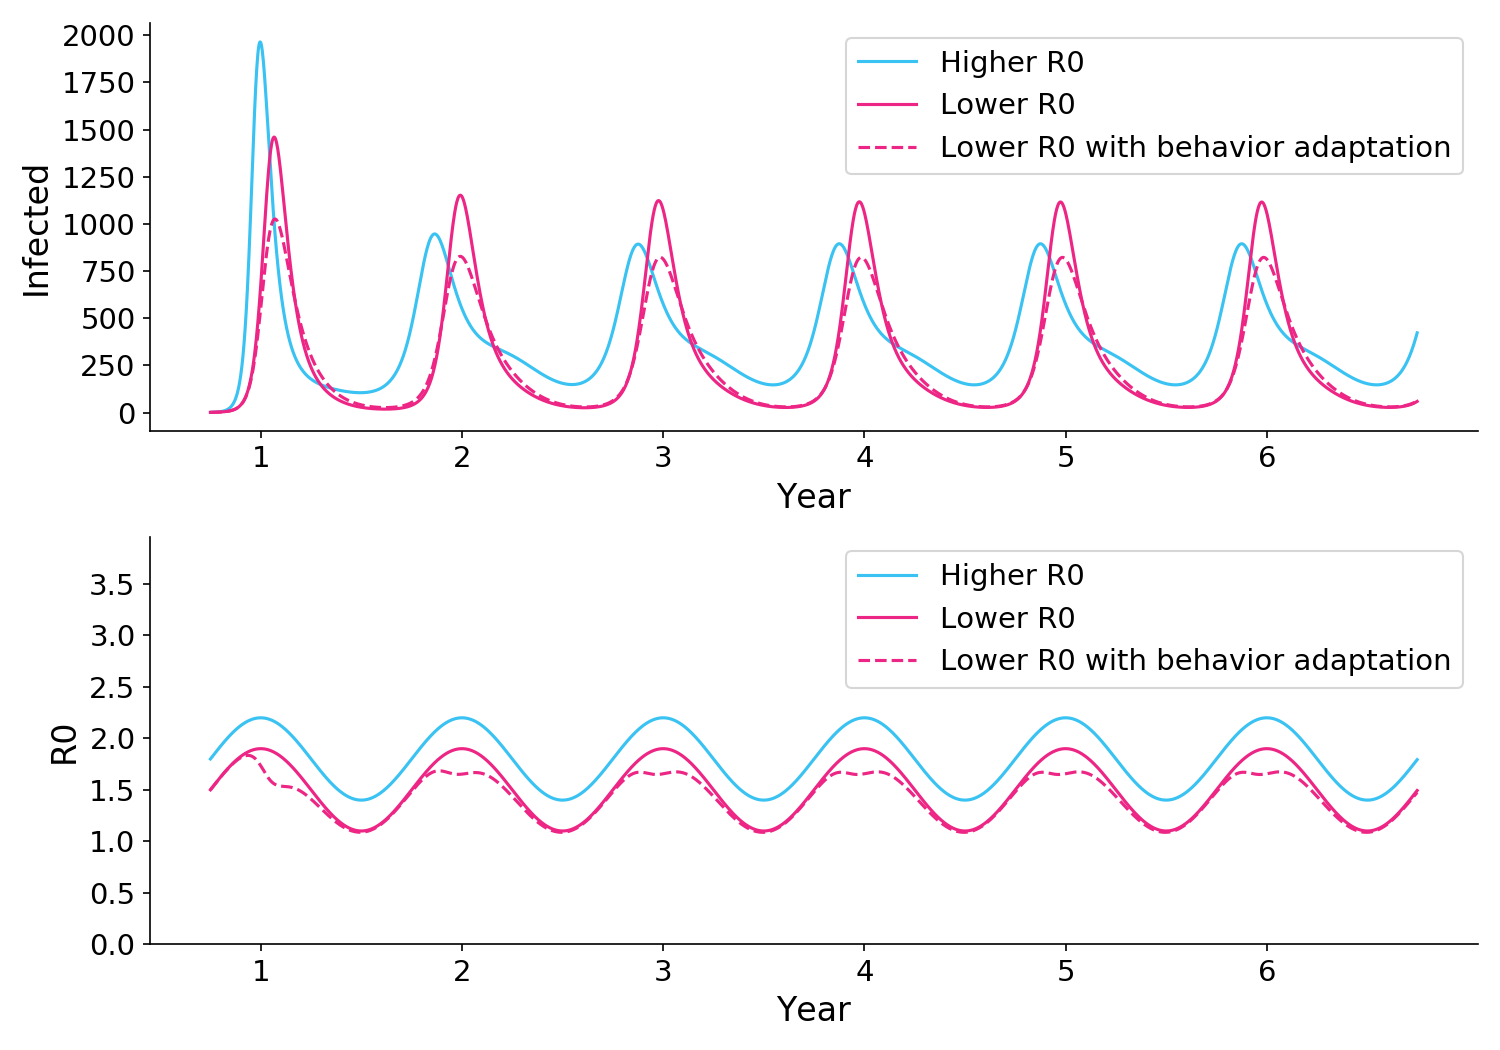
Figure 4. As in Figure 3, a blanket reduction in R0 (solid pink) can cause higher peaks. But if R0 is reduced even further during infection peaks (dotted pink), the infection peaks can be brought under control.
These results are pretty robust
My main observation is robust to a wide range of parameters. In all scenarios, reducing R0 reduces the overall count of cases. And if you push R0 down hard enough you can even get to Zero Covid.
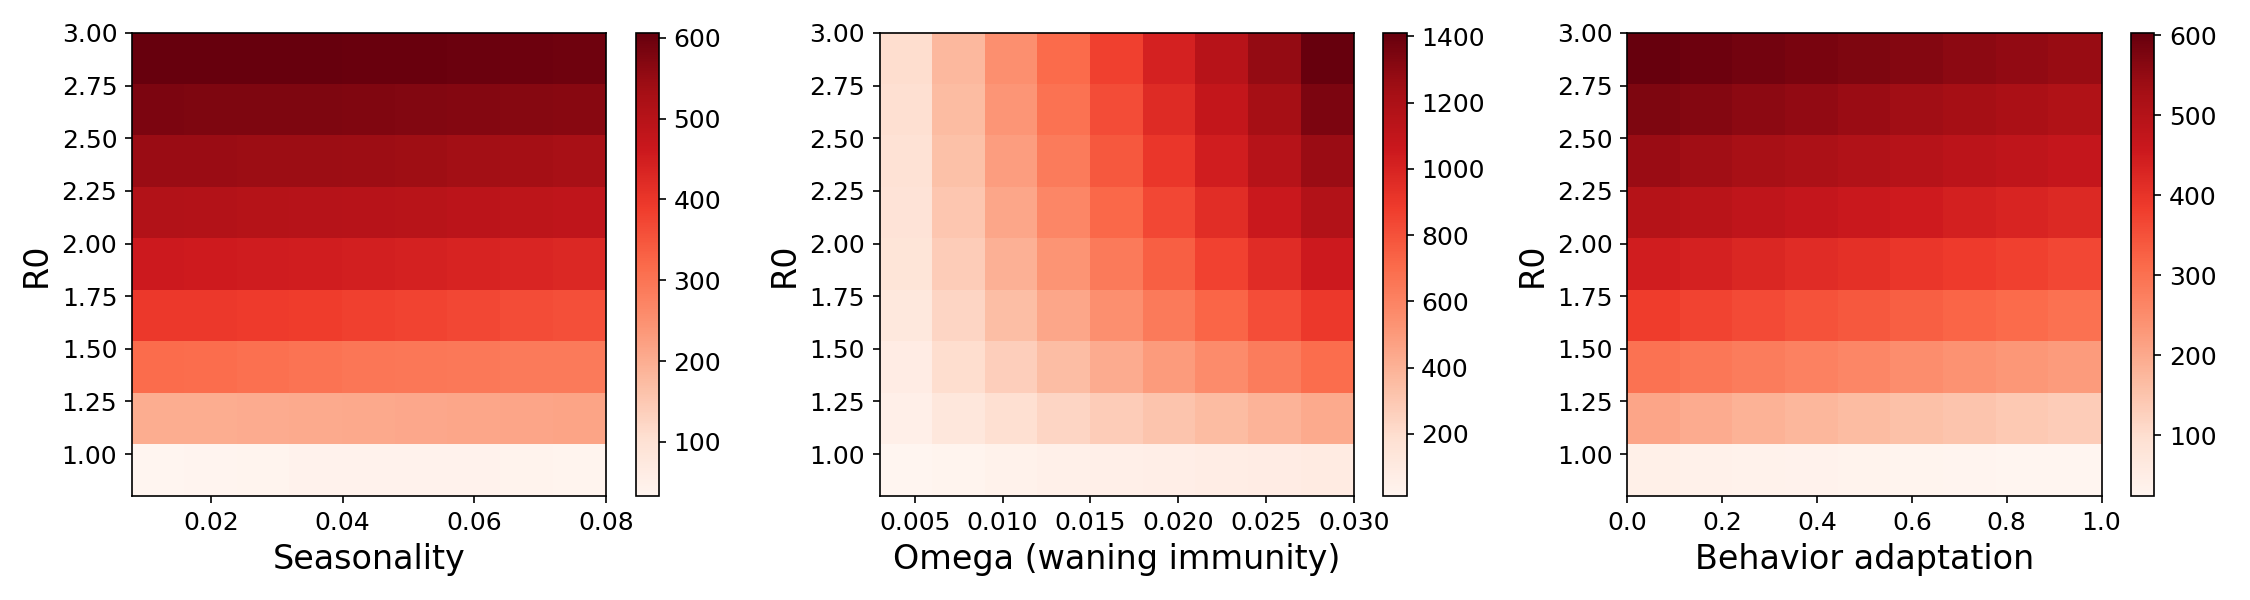
Figure 5. Average number of infected individuals per day under a wide range of parameters, restricted to years 2-6 of the epidemic. In all cases, reducing R0 (vertical axis), reduces the number of infections.
The “dry tinder” observation is less robust, but still very real in much of the space. For a wide range of parameters – particularly where R0 is already high – reducing R0 can paradoxically increase the peaks of waves. Adapting behavior during peaks can mitigate this effect.
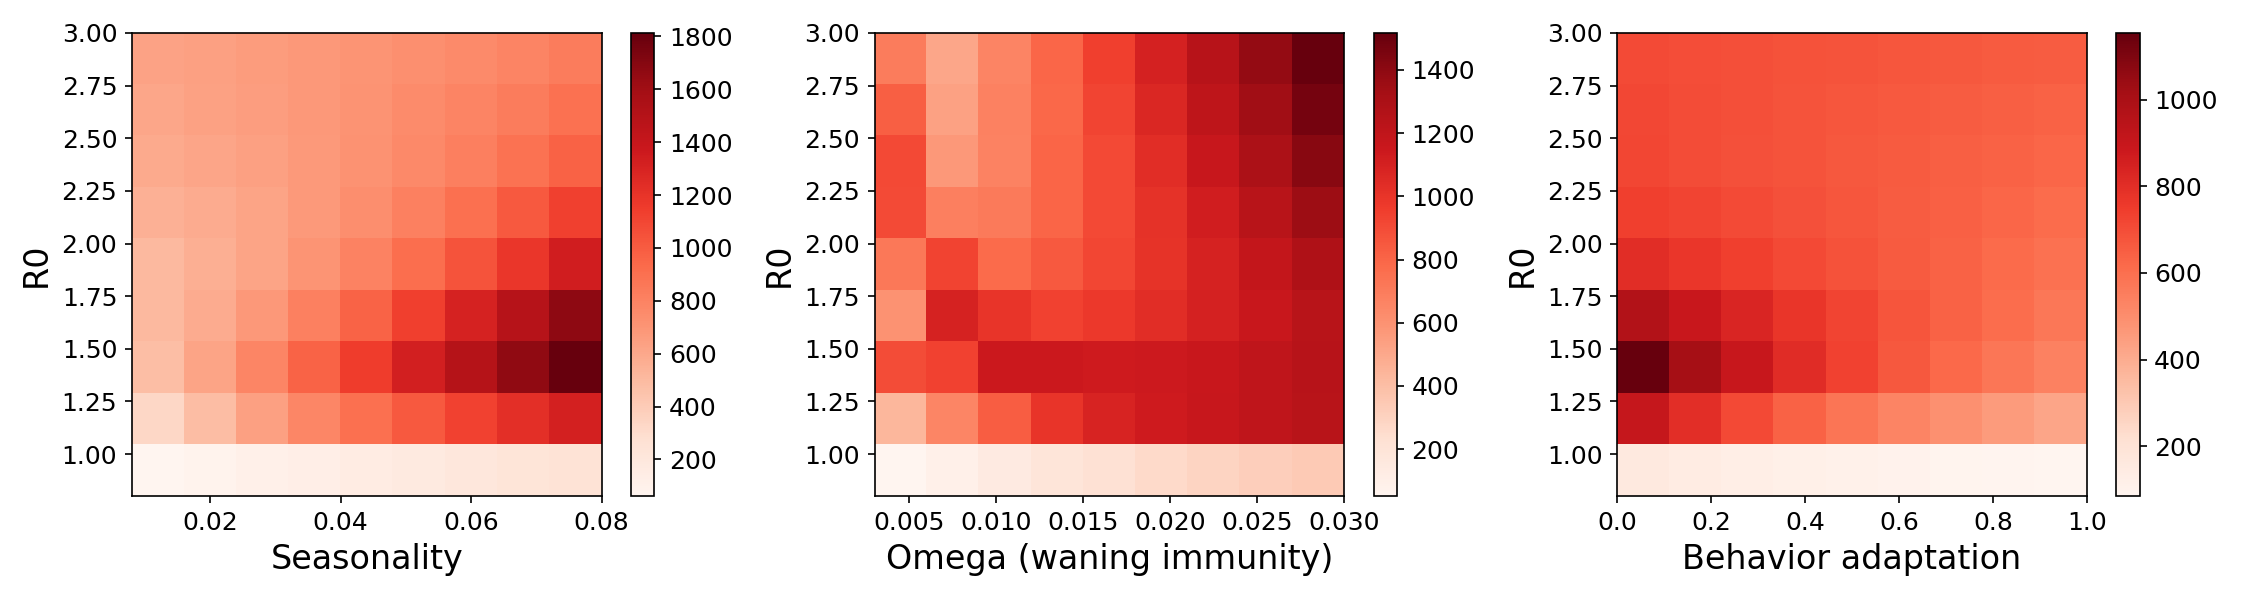
Figure 6. Peak number of infected individuals under a wide range of parameters, restricted to years 2-6 of the epidemic. For much of the space, particularly where baseline R0 is already high, reductions in R0 can cause a paradoxical increase in peak infections. Once R0 is sufficiently low, the effect reverses and infections trend towards zero.
Implications
The modeling tells us that reducing R0 a little bit (e.g. via NPIs like masks or testing) can somewhat reduce infections, even though waning immunity might mean we continue to experience large waves indefinitely.
But what should our policy be? Do we really want to mask indefinitely so we can slightly reduce infections? Some people highly value a reduction in infections, and they will call for continued use of NPIs. Others point out that vaccines have made the disease milder, and the social burden of NPIs may not be worth it, particularly for children and those who can’t work from home. Those questions are outside the scope of this post, but they can and should be answered democratically.
Limitations
Among the many things not accounted for in the model are exposure periods, hetereogeneity, network clustering, new variants, partial immunity, cross immunity, vaccination, and boosting. Vaccination works by reducing the number of susceptible people in the population. This can dramatically drive down infections but should not qualitatively change the dynamics of R0-reducing initiatives like NPIs. The model was not fit to real world data, although it did explore a large region of parameter space.